Monday, September 24, 2012

Can Lean and Corporate Governance Play Together?

We’re going to go deep behind Executive Lines this week so don’t get left behind.  There is quite a bit of regulation out there telling companies how to act, walk, talk, eat, etc, etc, and if you want to raise some capital by selling shares of you company on the market you will have much more to deal with.  I will not be providing any opinions on the Sarbanes-Oxley Act, but over the last 30 years Corporate Governance has received plenty of attention especially after Enron, Worldcom, and other situations.

What is corporate governance?

Let’s start with a definition on Corporate Governance.  Simply, it is the system by which companies are directed and controlled, (Wikipedia, SEP 2012).   It attempts to define the interactions between Board of Director members, management, and shareholders.   You could add stakeholders to this list also based on the amount of airplay companies receive.  But let’s focus on the basic definition words “system”, and “directed and controlled”.

Much of this addresses the communication path through management, the board, and shareholders.  We can see this in the shareholder reports, and on financial websites with the company’s balance sheet, income statement, and statement of cash flow.  Inside the company the communication the board and management uses should be  a little more action oriented.  When I say communication, I mean the metrics.

How good is the company’s delivery? 
Oh, it’s good. 
How good? 
Real good.

Sound familiar in the office area?  Does anyone really know?  When the strategic plan is built, there should be some recognition of measurable performance goals.  If you don’t know, go ask your customer what is important about the delivery of your product.  Oh, it needs to be good.  How good?  Real good.

What is a Lean System?

Let’s go back to this system.  When we talk about a Lean System, we are talking about making our office products at the rate or pull of customer demand.  Do we have this thinking in our systems?  Yes, that does mean to put Just-In-Time methods in our order systems.  Remember, JIT is not just about reducing inventory costs, it puts a glaring spotlight on the problem areas.  The same areas where we improve the flow of our information products.
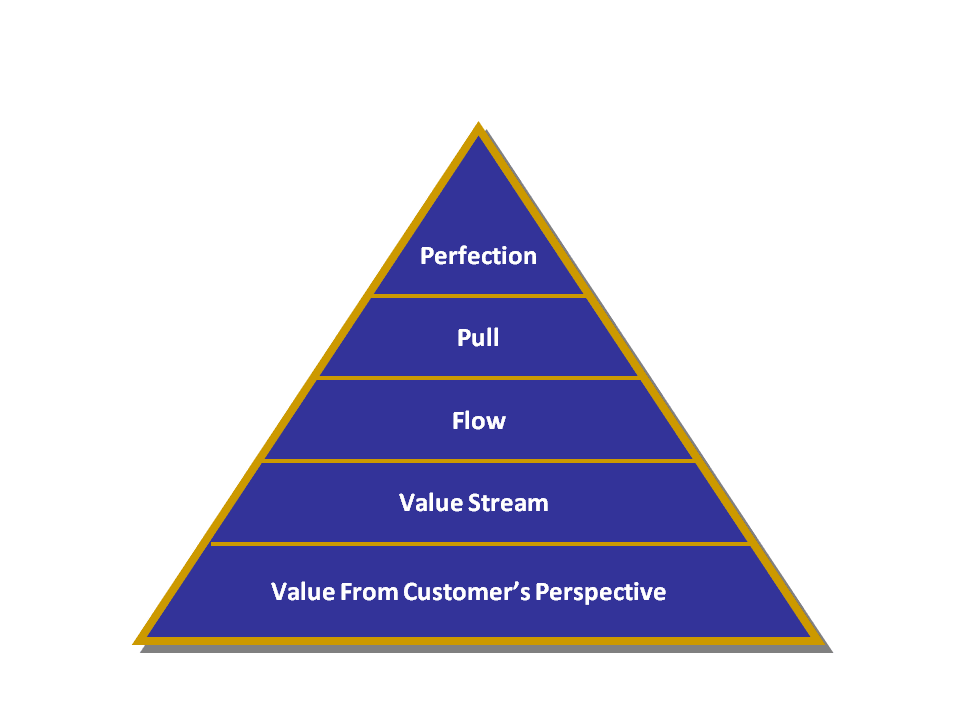
Align the Lean System with the Strategic plan and we begin to provide actionable metrics going to the board and management, and in the right hands of a visionary Leader this can produce transformation that strengthens the company and produces happy customer.  How happy?  Real happy!

The measures going to management should show how we are affecting the results.  These could show that performance is better, worse, or remained the same.  If the results have not changed, then the team has not found the root causes, or the improvements are not working and we will hold off the pizza party until we have sustained positive results.

Can we institutionalize continuous improvement?

Improvement can be institutionalized by creating the expectation, and required metrics to review, and growing the people who show aptitude for Leadership out of the ranks of Green Belts and Black belts.  I did not say that all Leaders should be belts, but there is a good place to look.  Leaders should have their performance measured and Executives do not have a “come-apart” the first time a chart is Red or Yellow.  These are indicators of process performance issues that need to be addressed.

ISO and CMMI provide frameworks of systems, but these are dependent on people working within the boundaries and keeping the documentation current.  Companies and teams still develop their own methods and processes and these should be measured and reported upon.  If you are not going to manage the process, then don’t measure it.  And don’t be surprised if you do not receive the performance you think that you are entitled to receive.

As we go through this journey, we should be using road signs and maps to help us see where we are.  Working with Leadership and our employees will strengthen the relationships and improve morale.  Doing the right things at the right time should result in satisfied customers.

Have you seen a successful transition of practices when Leadership has changed hands?

Monday, September 17, 2012

Future State Value Stream Mapping

Standing in the office, staring at the wall with your Current State Value Stream Map (VSM) pinned up, you may be thinking that someone needs to hide this thing before the boss walks in.  The communication lines look like one of those sketti-maps, and the work balance chart is normally distributed.  Take a breath and remember that this is a journey, don't stop believin'.

Remember the Normal Distribution?

Time for some calm and rational thinking, what did the Lean Policy Deployment matrix indicate that was the highest priority for the team?  You can see the operational targets and how they relate to what is important, but what does this mean for our processes?  Now we are connecting the dots between where we are now and where we need to be moving toward.  Do we have the measurements in place to help us see where we are?  If not there needs to be a line drawn in the sand for our baseline or starting point.

Take the goals from the Lean Policy Deployment matrix and any yearly "goals & objectives" given to the team, and connect them to your Current State VSM.  What picture emerges?  Does this flatten your work balance chart?  If you find that your goals do not change your VSM, you may have weak or ineffective goals.

Now is the chance to talk with the team.  Get their opinion on the obvious problems pointed out on the map.  What problems do they see on a recurring basis?  What opportunities do they see?  This is a great way to empower and engage the team.  They want to be listened to, they want to know that their input is valuable and that they are not just button pushers making documents go somewhere.
Our VSM friend, the Starburst!

Armed with this data, you have something to talk about with the boss.  Show them where you think the problems exists, show the data, and then show them the starbursts that you and the team created.  Give some credit for the creativity of the team!  Talk about where you think you could improve performance and customer satisfaction.  The boss may provide some more goals to think about for transforming to a Lean flow.

Take the starbursts and place them on a Benefit/Effort matrix and now you and the boss have something to work with to prioritize the improvement activities for the coming year.  Below could be your new best friend for prioritizing opportunities, the PICK Chart.  Decisions made from this matrix will need to be balanced against the Lean Policy Deployment matrix.  Think about what is important to improve and what is attainable. 
PICK Chart
If this is your first time to attempt to formally improve your processes, take the top one or two prioritized opportunities and compare their goals to the Current State Value Stream Map.  What impact will these make to the 4P's or to Safety, Quality, Cost, and Delivery?  These opportunities may enable other improvements, like communication flow or decision making processes.  Don't let the fear of making Quality improvements impact what is executed first.

Now we bring in our tried and true project management skills and abilities.  Write a problem statement without any assumption of root causes, define SMART goals, and determine deliverables.  Document the project on a one-page A3, there is no need for a 125 slide project briefing.  There is nothing brief about 125 slides, seriously, knock it off!  Put the smart people in a room, find the "Belt" person you have heard about and start exploring what is going on with the process.

Share what you have learned with the work team as you go through the project determining root causes and deciding what your going to do about it.  Create some metrics and a desk guide to keep you from backsliding to the old, comfortable, chaotic process.  You are responsible for the team's results, own it!  When the process is fixed, celebrate the success with the team.

In 12 months you're going to go through this again.  Make sure you have your stuff in order.

Is change hard?  Yes, but so is coming into work everyday knowing that poor performance is making an impact to the team's moral and no one cares to make it better.

Have you seen VSM be successfully used as a strategic planning tool or ever been involved in a VSM "Event"?

Monday, September 10, 2012

Current State Value Stream Mapping

Transformation has many requirements, two of those are knowing where we are and where we are going.  This week we will address how to see where we are using Rother and Shook's "Learning to See" method of Value Stream Mapping.  If you want to learn more about your process, this is a perfect way to do it. 

First the rules (oh, no!  not more rules), Value Stream Maps are based on products.  Don't get hung up on thinking about factories, we all make something.  Gears, cars, hot dogs, lawn chairs, pizzas, newspapers, lumber, stock analysis, laptops, contract statements of work, testing instructions, decisions what to spend resources upon, etc, etc, etc; get it?  We all produce something that is passed on to the next internal customer or our final external customer.

Our Current State map


Here is our example Current State Value Stream Map.  Current state means how the product flows as of today.  Again, how the product ACTUALLY flows, not what your ISO documentation says, or how you wish it would flow, but the no-kiddin' real way it flows right now.  If you don't know, go ask the actual people doing the actual work, in fact I recommend you go find out who those people are right now.  Go ahead, I'll wait...

As you can see in the picture the inputs from suppliers are on the left and the output going to the customer is on the right.  The product going through the flow is on the lower half of the map and the information supporting the flow is on the upper half of the map.  Under the transformational activity boxes is where we will store some important metrics like cycle time, touch time, quality yield.  And last, but certainly not least, the time line along the bottom which we will use for part of our value analysis.

Did I say last?  Two more things, identify the product/process and put today's date on the map!  This is really important as you begin to start constructing these high level maps.  One day in the far future you will find a stack of maps and wonder which ones need to be trashed and you will not have a time reference.  Yes I said trashed, we are not cartographers.

There are several things we can read from this map.  Check out the balanced work chart in the lower left corner.  If you are in love with TOC, you should be able to identify where the bottleneck is located.  The Value Added calculation is based on the amount of work in the system in hours and the cycle time of each activity.  The amount of work is based on the calculation of the number of items in the flow and the cycle time for one.

WIP (the number of items in the flow) is an important measure because it represents labor costs and material costs.  Add them together and you know how much money you have tied up.  If you could reduce your WIP costs, what else could you do with that money?  Expand your capital, update your old computers, hire another sales person?  Is the communication flow adequate?  If you are only talking to the last person in the flow then you may not be seeing how the other sections in the product flow are performing.

These maps help to see where to attack first, where is the longest cycle time, lowest quality yield, or longest touch time?  If you have a Belt in your organization, get their help analyzing what is going on with the performance.  While we are asking uncomfortable questions, when was the last time you were on the floor?

So next week we will explore the construction and use of the Future Vision map that will contain the 5-year plan.

What has been your A-Ha! moments constructing your Current State maps?  Does it make you want to start implementing solutions?

Monday, September 3, 2012

Lean Policy Deployment

Aligning tactics to strategy

Welcome to September!  Guess what it is time for now?  That's right, this year's goals and objectives for the company.  How are we doing this year so far?  Did you set sales, safety, delivery, or financial goals?  Did you build that new capability you wanted?  Are your teams progressing in maturity?

These are worthy and usual safe things to chase, but are they the right things for your company or teams?  You will also find that you may have a team or site that is the benchmark for the company.  Translating your vision into the strategy is up to you and your board of directors, and determining how to advance to that vision will be executed by management and the teams.  Each team member is aware of their strengths and weaknesses, and this tool can help them grow into that type of person they want to be.


How to build
  1. Identify the key issues in the organization's customer focused performance.  These may come from a Value Stream Mapping Event or a strategic offsite meeting.
  2. Determine measurable business objectives that address these performance issues.  You are not boiling the ocean, and they do not say "do stuff better".  A good tool to use here would be a Balanced Scorecard.
  3. Define or Refine the overall vision and goals.  Goals will be listed under Target Operational Results.
  4. Develop supporting strategies for pursuing the goals.  These will be listed next to the Objectives.
  5. Determine the tactics (or projects) and targets that facilitate each strategy.  List tactics above Selected Projects and targets next to Improvement Targets.  
  6. Decide the strength of alignment within the matrixed entries on the map.
  7. Implement performance measures for every business process.  If it is worth doing, it is worth measuring and doing right.  Yes measuring is hard, but so is laying people off because you did not work on the things that were important.
  8. Measure business processes during execution.  Do not wait until the end of the year to see if you hit any targets.

How to measure

And now we are off and running!  We are delivering sales orders, reports, and briefings.  The team is collecting data and we are compiling it into something that tells the real story.  Whether we are using a fully automated workflow tool with performance reporting, or collecting information on a form and typing it in a spreadsheet, we need to make sure we share it with the team.

Don't try to create excuses if the information is not great, we are smart enough to see through management's smoke screens.  This is the perfect opportunity to use some A3 Problem Solving.  Use the results to strengthen your system and processes, and celebrate your successes once in a while.


What results have you seen with your improvement planning?

Monday, August 27, 2012

Lean Flow and Employee Involvement


There is no shortcut or back road to Lean transformation, it's not a journey you make on your own change, and it's not a top-down only effort.  But you have some busy people that can help you navigate in the dark, they are your employees.  How many of us remember when work arguments were won based on volume and creative profanity instead of the facts and data of the situation? The yelling may have diminished, but I'm not sure we are all in for using facts and data.

We do know that it is rough out there, but this is not the time to hide in the office and wait for the dust to settle.  Now is the time to look at how we do things to better meet customer needs and expectations.  We know that Lean is based on the Toyota Production System and part of the foundation is "Respect for People".  Everywhere I have worked, Leadership says that "People are our most important asset".  Does anyone know what that really means?

Lean Transformation Model
As you notice from the model we start with choosing one of our products and ask the team what they think their customers would say about that product.  We need to go talk with the customer also, but this gives us a starting point.  Share this information with the team, it may shock or surprise them (or confirm what they know) but the truth will be there out in the open.  Think about how these truths align with the 4P's.

When we map and measure the processes that support a product we are using the team not only to uncover the hidden processes we use, but so we all have a common understanding how we construct that product.  There will be human interactions the team may not have experienced before and you need to be ready to lead them through the various situations.  Make sure you attempt to includes everyone's voice.  Even your hard working introverts that are not sitting at the table (there they are along the wall) have something to say.

If you have adequately defined the flow problem and identified the most likely direct root causes, ask your team members for their suggestions to overcome the causes.  Some of the team may have been through that type of problem and could have the answer.  Try the solutions before any wide-scale implementation to uncover any constraints you may not have anticipated.  One person on the team, or the boss, will not have all of the answer that is needed, but each person may have a piece of the answer and it is up to you to create the picture of the new process.

Once you have the solution implemented, track the performance and share the results with the team.  This should be displayed on a board in a common area and where you hold team meetings.  You may even be able to connect that information with customer surveys or financial analysis.  Share the before and after data with the team to show them their efforts are making a difference.

What has been your experience working with teams or being on a team that improved one of your processes?

Monday, August 13, 2012

Change Fundamentals

“Change makes me feel uncomfortable.”
“Change is hard.”
“We don’t need to change, everything is fine.”

I’m sure you have heard these before, maybe even said something like this.  But now you are in a position of Leadership or you are responsible for the activities of a team and you see that you’re not reaching the performance levels you need to get ahead.  Money Girl may be scheduling meetings with you twice a week to discuss your budget numbers.  You could be meeting twice a day and that is not going to solve your problems.


This model is used help align groups of people to specific results and keep them within the left and right boundaries of their tasks and responsibilities.  The Beliefs of the individuals on the teams will lead to the Behaviors which drive their Actions that produce Results.  This helps to show why people think “Change is hard” and you do not see the Results.  Turning the team around is not only your responsibility; it’s in your skills toolbox.

The first step is the hardest because the team’s lack of momentum has anchored them to the past.  Did they win a team performance or safety award ten years ago?  Does your team currently perform the best in the branch but their internal competitors should all be sent back to the farm team?  You may find the team is the “cream of the crap” and this is never a nice realization.

You need to find out what the team Believes.  Do they really know their performance or want to know?  Do they believe they have the ability or permission to make change?  Do the team members have the skills, knowledge, and ability to perform the work that is being asked of them?  And there are more questions you could ask based on your industry or location.

Beliefs are the hardest to change; many were shaped by past experiences.  You will be battling against previous good or bad managers, corporate cultures, left-wing professors, and perhaps an undesirable work ethic.  Some team members will be easy to shift and a small number, if any, will probably need to be released back to wild.  Jim Collins talked about having people in the right seats on the bus, assuming they are on the right bus to begin with.

Tools to help Leaders re-align the individual’s and team’s Behaviors are the Company’s Vision, Mission, Goals and Objectives.  Do your team members know how and where they fit in the Vision and Mission?  This may take some exploration with the team and your Leadership.  I have seen teams try to determine how they fit, review this with Leadership and are sent back being told to try again.  This is not a catastrophic event as long as you can show you are learning from the experience.

Goals and Objectives play a large part by providing a basis for measuring the team.  Remember that not every team will have Objectives for every Goal, and try not to overthink your importance to the site but be open to how everyone fits together.  Goals should link Objectives to the Vision and Mission.

Measuring the team’s current performance to the Goals and Objectives can be an enlightening event that will drive the team to Action.  Don’t just print the chart and stick it on the wall, share it with the team and ask questions that lead to sustained high performance.  Using A3 Thinking helps to document what the team is experiencing and how they can learn by evaluating the low and high performance times.  This learning is documented in the team’s standard work, SOP, or Desk Guide and is used for training new team members.

These Actions will create Results with increased performance, higher levels of predictability, and increased team moral.  We are not just robots moving paper from one pile to another pile; we are thinking creatures with drive and a desire to make customers happy with the products we provide.  The processes we work in will not improve on their own, they require the ingenuity and creativity we have in all of us to make change.  It is there, just waiting to flourish.

How have you seen or experienced a change in hearts and minds?

Monday, August 6, 2012

Poke-Yoke the Engineers

Being an engineer and forced into a box did not "feel" right.  How am I supposed to use my technical creativity to take these requirements and turn them into something you can hold in your hand?  Get away from me with your process stuff, I'm here to (hold up your shield) support the customer!!

I acted this way for a time while adjusting from being a recent college graduate to a responsible and productive member of society.  I had my office, with three computers, bookshelves full of component specs and design books, and my attitude of "THESE HANDS WERE TOUCHED BY GOD!!".  Obviously those people don't understand my brilliance and I must dumb-down my methods to meet their level of intelligence.  Now, if I could automate the human out of the equation quality and productivity would instantly improve.

Wow!! Was I really that full of myself?  I don't think I was very helpful during that time in my career.  I had just left Uncle Sam's Misguided Children two years before and graduated with my Manufacturing Engineering degree a few months prior. I had a few career successes and my level of confidence in my abilities were over-the-top.  I had lost my touch with reality and the work relationships suffered.

It only took a project or two to learn that my work produced a product that was needed for another team on the floor and their success (read as OUR success) was based on how well I performed, not just technically but to their schedule. I learned there was enough variation in my output to disrupt everything on the floor when I worked in my own smoke-stake or rice bowl.

We started by paying attention to the feedback coming from the floor.  How often were they coming back for us to fix something, how much time was spent during changeover, and how often did we deliver our products late to their need?  Simple, but powerful measures to gauge performance.  When we analyzed the data coming from the floor, we found the enemy and he was us.

Continuous Learning Cycle
Our first move was to document changes being made on the fly and changes being made at our desks.  Most of the changes had been made on the floor, which hid most of the problems and the information showed us how bad our product was.  A picture began to form showing what exactly who the culprits were and they were quickly standardized through our purchasing department.

Next we checked all our computers to ensure we were all connected to the right data sources.  Some had "drifted" off course and was quickly realigned to master libraries.  We saw a vast quality improvement after the last of the "bad" product had gone through the system.  It looked like the worst was behind us, but in reality we were still in a fragile state.  We still needed to update our standard desk guides.

When we stabilized our output, we began to chance variation in the inputs.  The design engineers had their design software connected to standard data sources linked to our MRP system.  We tracked our requests to them to fix their problems, shared that data in a professional manner, and saw results.  We found problems in the MRP system also and many times the reason was they did not think that option mattered to anyone.

It is great to feel like the hero that saves the day, but after a while we get tired of the same old problems.  It looks like no one cares when things do not improve on their own.  We live in the information age, and when there are problems with the information flow we have to address those to closure.

What has been your experience working in the data flow?  Have you seen improvements over the last few years?